A monthly owner review
Close the month with a consistent view of income, costs, and the result.
 ExcelCraft
A WORKBOOK FOR YOUR WORKING DAY
Bring revenue, costs, and your plan into one view. Explore the monthly story, follow the year, and see what is changing before your next business review.
No sign-up · Local browser editing
FROM ACTIVITY TO UNDERSTANDING
A sales total is a starting point. Put the costs beside it, compare the result with your plan, and use the same reporting structure each month.
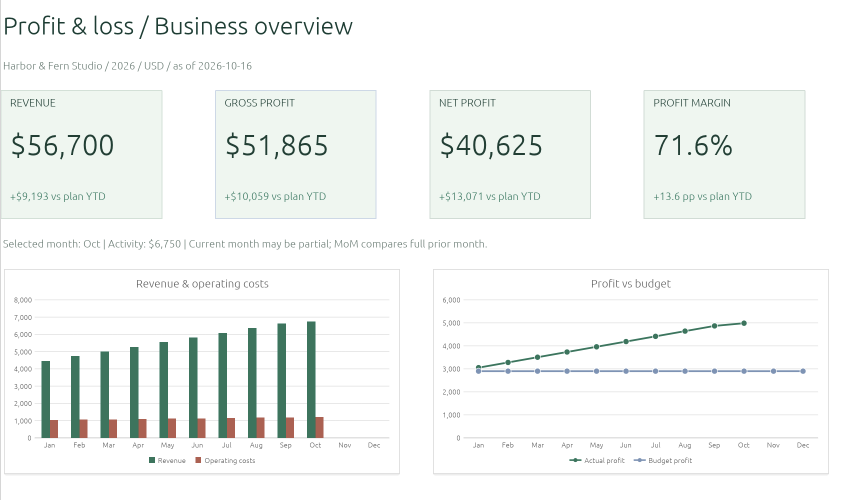
Review revenue, cost of sales, operating expenses, gross profit, and net profit together. Move from a Dashboard overview to monthly and annual reports.
Compare a budget with actual figures for the same reporting year. Monthly charts divide the annual plan equally across 12 months. Dashboard Plan YTD prorates the annual plan by elapsed calendar days through As Of; it is not a seasonal forecast.
Record income and costs in their own ledgers. Review flagged entries and reconciliations in Checks before relying on a report.
INSIDE YOUR WORKBOOK
Reports, inputs, and controls have their own place. Begin with the example and use Instructions to understand the fields and input limits.
Monthly and Annual use the selected reporting year. Actuals stop at As Of. Future actual months are blank in charts; report totals retain zeros for reconciliation. The selected month identifies the Dashboard activity note.
Dated revenue, references, categories, and customer refunds.
Cost of sales and operating expenses, including supplier credits.
Annual amounts with their own year, type, and category. Monthly budget is the matching-year annual plan divided by 12.
Company, reporting year, selected month, currency unit, and As Of date. Expense categories use seven existing slots; keep Other as the final fallback.
Investigate flagged inputs and reconcile the totals to their supporting detail.
Field guidance, assumptions, and checks. Business input tables support 500 rows; review the instructions before extending them.
MAKE IT PART OF YOUR ROUTINE
Understand the profit behind a busy month.
Close the month with a consistent view of income, costs, and the result.
Compare recorded activity with the budget and investigate the differences.
Use the report and supporting entries as a starting point for review.
YOUR FIRST FEW MINUTES
Open online to explore fictional records, or start blank to enter your own. Both use the same workbook structure.
Start in Settings. Review the company, year, month, currency unit, and As Of date before entering figures.
Add income and costs to the relevant input sheets. Keep the budget in the same reporting year and use a consistent accounting basis.
Compare Dashboard, Monthly, and Annual. Resolve Checks, then use Export XLSX in the editor to keep your changes.
A FEW PRACTICAL ANSWERS
Keep the reporting context clear, review the checks, and keep a copy of your work.
It is a manually maintained management report. It does not connect to a bank, maintain a full general ledger, prepare tax returns, or produce statutory accounts.
Each budget row has its own year. Reports select the matching-year annual plan, so changing the reporting year does not reuse an old budget. The monthly plan is annual budget divided by 12, not an individually entered monthly forecast. Dashboard comparisons use Plan YTD: annual plan multiplied by elapsed calendar days, including As Of, within the selected reporting year. The planned margin is unchanged by prorating.
Settings has seven category slots. You can rename the first six; keep Other as the seventh fallback. Update matching category names in your records and budget, and review Checks after changes. Adding more slots requires changes to workbook ranges and formulas.
No. Income and cost recognition can differ from payment timing. Use a consistent basis for the P&L and use the invoice tracker separately for customer collections.
The example contains fictional business activity so you can explore the reports and formulas. Start blank keeps the workbook structure for your own records.
Use Export XLSX inside the editor before closing the tab, then reopen the exported copy and check the figures. There is no automatic cloud save.
Use one currency consistently within a workbook. The files use USD ($) number formats. Changing the currency label does not update those formats. It does not convert exchange rates or consolidate currencies. Change number formats manually for another currency.
ExcelCraft uses the alpha-stage GridCraft engine. Recalculation, charts, formatting, and XLSX import/export can vary. Review a saved copy before relying on important figures; exact Excel or Google Sheets compatibility is not promised.
YOUR NEXT BUSINESS REVIEW
Explore the example, inspect the formulas, and make it your own.
Your workbook stays in this browser while you edit. Use Export XLSX in the editor to keep your work. Review formulas, totals, and the exported copy before using important figures. How local files are handled.
Original ExcelCraft workbook design and fictional sample data · CC0. Manual records; no bank connection, automatic cloud save, or collaboration.
WORK WITH THIS FILE
KEEP THE WORK MOVING
Profitability, collections, and paid spending answer different questions. These are separate workbooks; records do not synchronize between them.